The First Horse of the Apocalypse?
There’s been a fair bit of media attention on the Treasury Yield Curve lately, so I thought I’d dig into that a bit this month.
Investors look at a LOT of indicators to try to figure out where the economy and the stock markets are headed. There are several leading indicators that you can look at, but one that is on practically every list is the shape of the Treasury Yield Curve because it’s often one of the first visible signs of trouble to come.
What is the Treasury yield curve?
Every month, the U.S. Treasury issues bonds with maturities of as little as one month to sometimes 30 years or more. Once issued, these bonds trade in capital markets every day. Since U.S. Treasury bonds are considered risk free (backed by the full faith and credit of the U.S. Government), they are a very clear indicator of the lowest rate of return investors are willing to accept on an investment for a given time period.
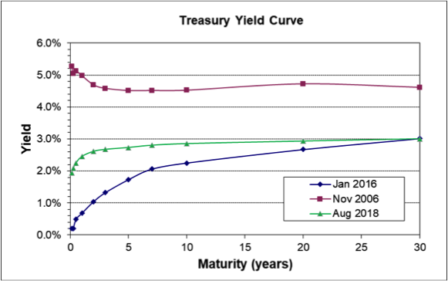
Under normal conditions (see the blue line from January 2016 in the attached graphic), investors will demand higher returns (higher yields) for money invested a long time than they will for money invested over very short time frames. This is one reason bank CDs offer higher returns for five years than for 12 months. In fact, a bank CD typically offers more yield than a savings account, which can be withdrawn any time. Longer-term investments usually offer higher returns.
Why does the yield curve invert?
An inverted yield curve means that investors are demanding higher returns for short-term investments than for long-term investments. Said another way, they are willing to accept lower long-term yields because they believe the economy will do poorly in the near-term.
This will be most obvious looking at the difference between bonds maturing in less than one year compared to those maturing in 10 or 20 years. The red line in the graphic shows the Treasury Yield Curve from November 2006. At the time, investors were becoming nervous about the state of the housing market and the economy in general.
According to Bloomberg Intelligence, the Treasury Yield Curve has accurately predicted every recession for the past 40 years. Since the stock market tends to sell off before recessions begin, it’s easy to see why investors are so interested in where the economy is heading. The challenge is that the yield curve inversion can happen many months before economic conditions actually worsen. In this example from 2006, the curve first inverted in August 2006, sixteen months before the recession began and about fourteen months before the stock market sold off. It may be an accurate indicator, but it isn’t very timely.
What is the Treasury yield curve telling us today?
The green line in the chart (from August 21) shows a curve that is a LOT flatter than just a couple of years ago, but is not yet inverted. It suggests that investors are becoming nervous about conditions, but not right away. So even if short-term yields did rise higher than long-term yields, the actual timing of a market sell-off or recession is still not guaranteed. Since the average lead is about 16 months before a recession, it wouldn’t mean you need to take cover immediately. But it would mean to start thinking about how a recession might impact you and to prepare for some volatility in the months ahead.
One last word of caution
Few investors have historically been able to consistently time their buying and selling so as to be in the market for the good times while avoiding losses when it gets rough. Indicators like the yield curve are useful tools, but they are far from perfect.
If you need help reading the signs and interpreting the markets, a CERTIFIED FINANCIAL PLANNER TM (CFP®) professional can help guide you towards an all-weather portfolio designed to minimize losses in a downturn while growing your portfolio during the good times.
This column is prepared by Rick Brooks, CFA®, CFP®. Brooks is director of investment management with Blankinship & Foster, LLC, a wealth advisory firm specializing in comprehensive financial planning and investment management. Brooks can be reached at (858) 755-5166, or by email at rbrooks@bfadvisors.com. Brooks and his family live in Mission Hills.
Category: Business, feature, Local News